Data Analytics & Actionable Insights
Unified Business Intelligence Platforms
From fragmented databases to a single, real-time source of truth
100%
Attribution & Traffic Visibility
If you don't trust your tracking, you can't trust your decisions. Fragmented data across different marketing channels makes it easy to waste capital on ads that don't convert.
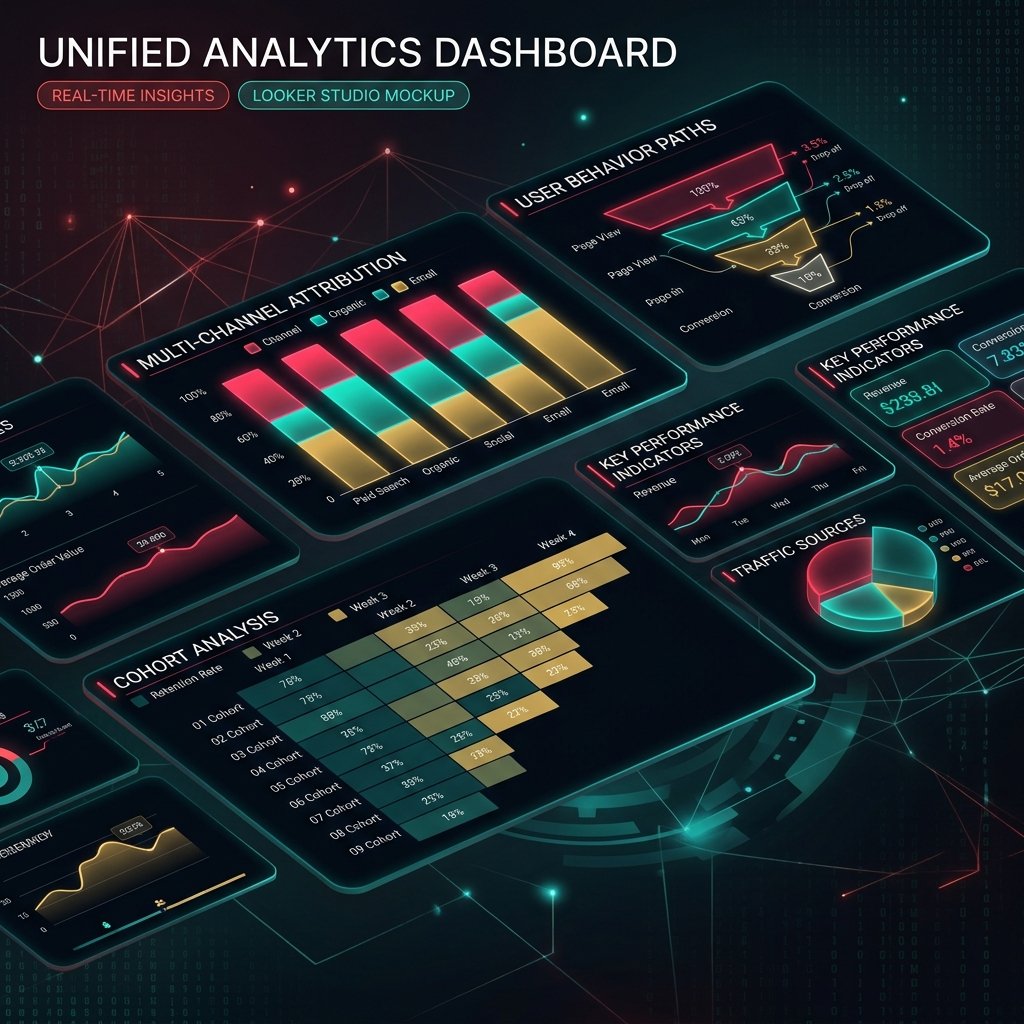
Our Data Analytics platforms unify your ingestion loops, clean transaction logs, and format Looker Studio dashboards to update every hour.
Know exactly which channel drives margin, and scale your spend with total certainty.
ETL Pipeline Architecture
How raw transactional logs are fetched, normalized, and unified into Looker panels:
1. Raw API Fetch
Daily/Hourly CRON scripts trigger REST requests to fetch transaction logs, cost variables, and logs.
2. Cleansing & Indexing
Database cleanses transaction IDs, maps first-touch dynamic tags, and updates cohort indices.
3. Looker BI View
Renders clean interactive metrics, CAC updates, spend filters, and conversion funnel graphs.
100%
Visibility across cross-channel attribution
+28%
Marketing ROI uplift from data optimization
-45%
Reduction in time required to generate reports
Hourly
Data synchronization rate of financial pipelines
The Data Silo Dilemma
Most scaleups operate with siloed information. Google Analytics lists one purchase total, Shopify shows another, and Stripe reports a third. This leads to reporting clashes and makes it difficult to calculate true LTV or CAC.
Marketing spends ad capital on campaigns that show high click counts but fail to generate long-term customer value. Without cohort retention analytics, this waste remains hidden.
Compiling weekly spreadsheets manually is slow, prone to errors, and stops executives from taking fast actions.
"Data is only valuable if it drives actions. Siloed metrics generate reports; unified data generates revenue."
We solve three main analytical friction points:
The Analytics Framework
We build unified pipelines that pull, cleanse, and structure your logs automatically. No more manual exports.
Repurchase Cohort Retention Grid
| Cohort | Users | Month 1 | Month 2 | Month 3 |
|---|---|---|---|---|
| Jan 2026 | 12,450 | 100% | 45.2% | 38.4% |
| Feb 2026 | 14,100 | 100% | 41.8% | 29.1% |
| Mar 2026 | 15,800 | 100% | 44.6% | 32.8% |
01. Unify Data Pipelines
We connect APIs to a central warehouse node to build unified dashboards that update on a schedule.
Key Architecture Components
- Automated ETL Loops: Sync Shopify, Stripe, Google Ads, and CRM data into one SQL database automatically.
- Attribution Modeling: First-touch, last-touch, and linear models to find what actually drives transactions.
- Hourly Looker Panels: High-impact Looker Studio dashboards tailored for your executive team.
- Custom Cohort Retention: Track customer lifetime value (LTV) and repurchase rates month-over-month.
Building the Ingestion Nodes
Reliable Ingestion Pipelines
We write secure connector nodes that ingest raw event data, format dates and currency, and resolve duplicate IDs:
Every click, cart addition, and purchase updates the data warehouse, so you see real-time performance on your monitor.
Cohort Analytics
Tracks customer repurchase rates over 30, 60, and 90-day periods.
Attribution Matching
Resolves first-touch click data with bottom-of-funnel Stripe checkout details.
Custom BI Dashboards
We compile custom Looker Studio dashboards tailored around your specific team KPIs. Instead of loading dozens of generic charts, we design focused dashboards that highlight exactly where your budget is performing.
- Unified customer acquisition cost (CAC) tracking
- Real-time ROAS metrics calculated across Facebook & Google
- REP productivity metrics and sales speed tracker
- Cohort LTV modeling to guide long-term acquisition spend
The goal is: making metrics clear, reliable, and actionable.
Centralizing Database Control
-
Managers log into Facebook Ads, Google Ads, and CRM separately↓
-
Manually export CSV spreadsheets (every Friday)↓
-
Align data columns, fix typos, check calculations manually↓
-
Deliver static report to executive board, hope data is accurate
Time Spent: 6-8 Hours every week. Guesswork on attribution.
-
Ingestion scripts pull event data via Webhooks automatically↓
-
Central database cleanses logs and merges user sessions↓
-
SQL scripts match ad cost to Stripe transaction IDs↓
-
Looker Studio dashboard updates hourly for total visibility
Time Spent: 0 Hours manual updates. Accurate multi-touch attribution.
Database Optimization Impact
Below are performance metrics tracked across enterprise accounts post analytics integration:
| Analytical Metric | Before Integration | After Integration | Performance Change |
|---|---|---|---|
| Attribution Match Rate | 62% (Estimated) | 98.4% (Verified) | +58.7% Visibility |
| Reporting Time Lag | 7 Days (Weekly batch) | Hourly refreshing | Real-time decisions |
| Monthly Reporting Labor | 24-32 Hours | 0 Hours (Automated Looker) | 100% Labor Saved |
| Data Discrepancy Rate | 12.5% (Average) | < 0.5% (API validated) | Clean Audit Logs |
Financial Impact Example
+$124,000
Reallocated from failing campaigns using attribution insights
Unified attribution data showed that one of the client's high-budget ad campaigns was generating leads that bounced immediately without repurchasing.
We reallocated that budget to a lower-cost search campaign showing high customer lifetime value, boosting overall margins immediately.
Make ad decisions based on verified ROI, not click volumes.
The Core Wins of Unified Analytics
Clean data pipelines provide security and clarity across your corporate operations:
01.
Reliable Performance Metrics
Every purchase ID is cross-checked to guarantee 100% report reliability.
02.
Instant Decision Making
Review campaign metrics every hour and adjust ad budgets based on live trends.
03.
Cohort Repurchase Tracking
Uncover customer lifetime value trends to guide your growth investments.
"RedRuby integrated our Shopify, Stripe, and ad channel databases into one Looker panel. We now track CAC and repurchasing cohorts hourly, saving us days of manual spreadsheet formatting every month."
Financial Director
Elevate Academy
Ready to Centralize Your Data?
We will audit your data architecture and build automated pipelines to give you complete visibility into your margins.
Get A Data Ingestion Audit- Hourly Ingestion pipelines
- Looker Studio Setup & Custom Panels
- Cohort repurchase tracker
- API Credential Audits & Access Setup
Frequently Asked Questions
How does RedRuby build custom data analytics platforms?
We develop unified analytics platforms by configuring cloud ETL pipelines to BigQuery, consolidating disparate database models, and building interactive, clean Looker Studio panels showing complete customer LTV maps.
What are the benefits of unified attribution dashboards?
Unified dashboards map the entire B2B or patient journey by linking marketing spends directly with client actions, indicating exactly which channels are driving profitable outcomes.
Can database solutions connect with Google Analytics 4 (GA4) and Looker Studio?
Yes, our integrations link GA4 stream data with backend SQL tables using safe API connectors, giving you real-time visibility into attribution, cohorts, and customer repeat purchases.
AI-Powered Automation & Platforms